![The 1064/364-Day Bitcoin Cycle [INFOGRAPHIC]](https://www.shortspike.com/static/34/1064-364-cycle__scale_and_crop__500x281.png)
 Markets, data, and the ideas shaping them.
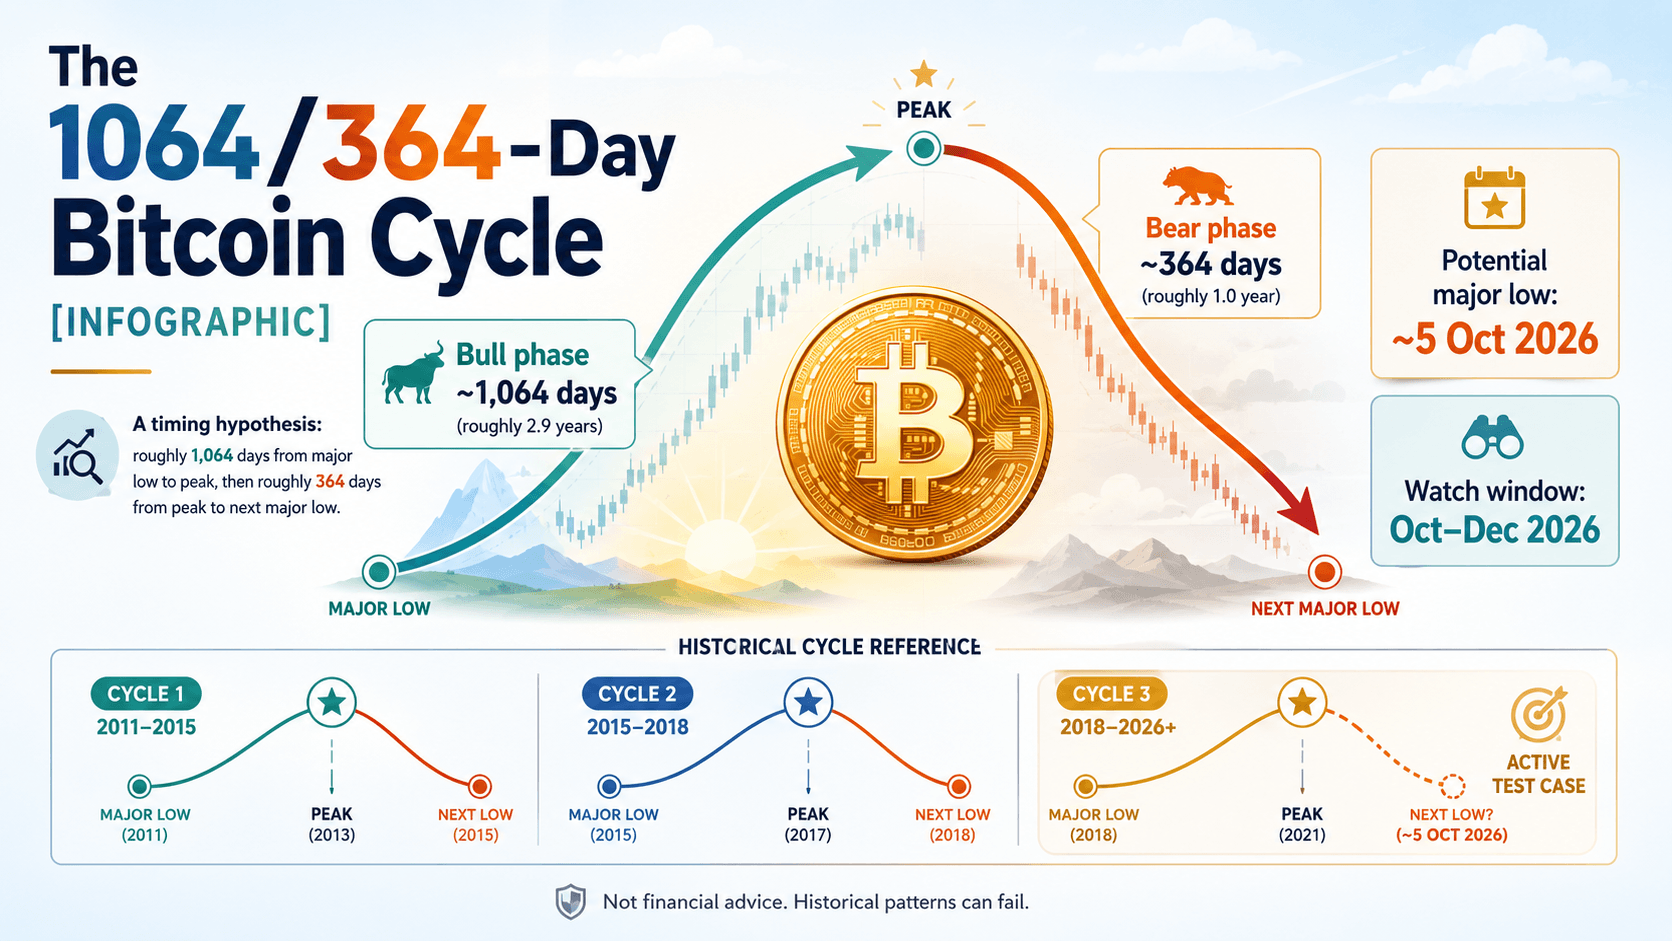
The 1064/364-Day Bitcoin Cycle [INFOGRAPHIC]
Bitcoin’s next major test may come in late 2026. The 1064/364-day cycle theory suggests a potential major low around early October — but only the market can validate it.
Not financial advice: This article is for informational and editorial purposes only. Bitcoin is highly volatile. Historical patterns can fail, and no date or price level should be treated as a certainty.
The theory in one sentence
The 1064/364-day Bitcoin cycle is a timing hypothesis: Bitcoin has historically taken roughly 1,064 days to move from a major cycle low to a major peak, followed by roughly 364 days from that peak to the next major low.
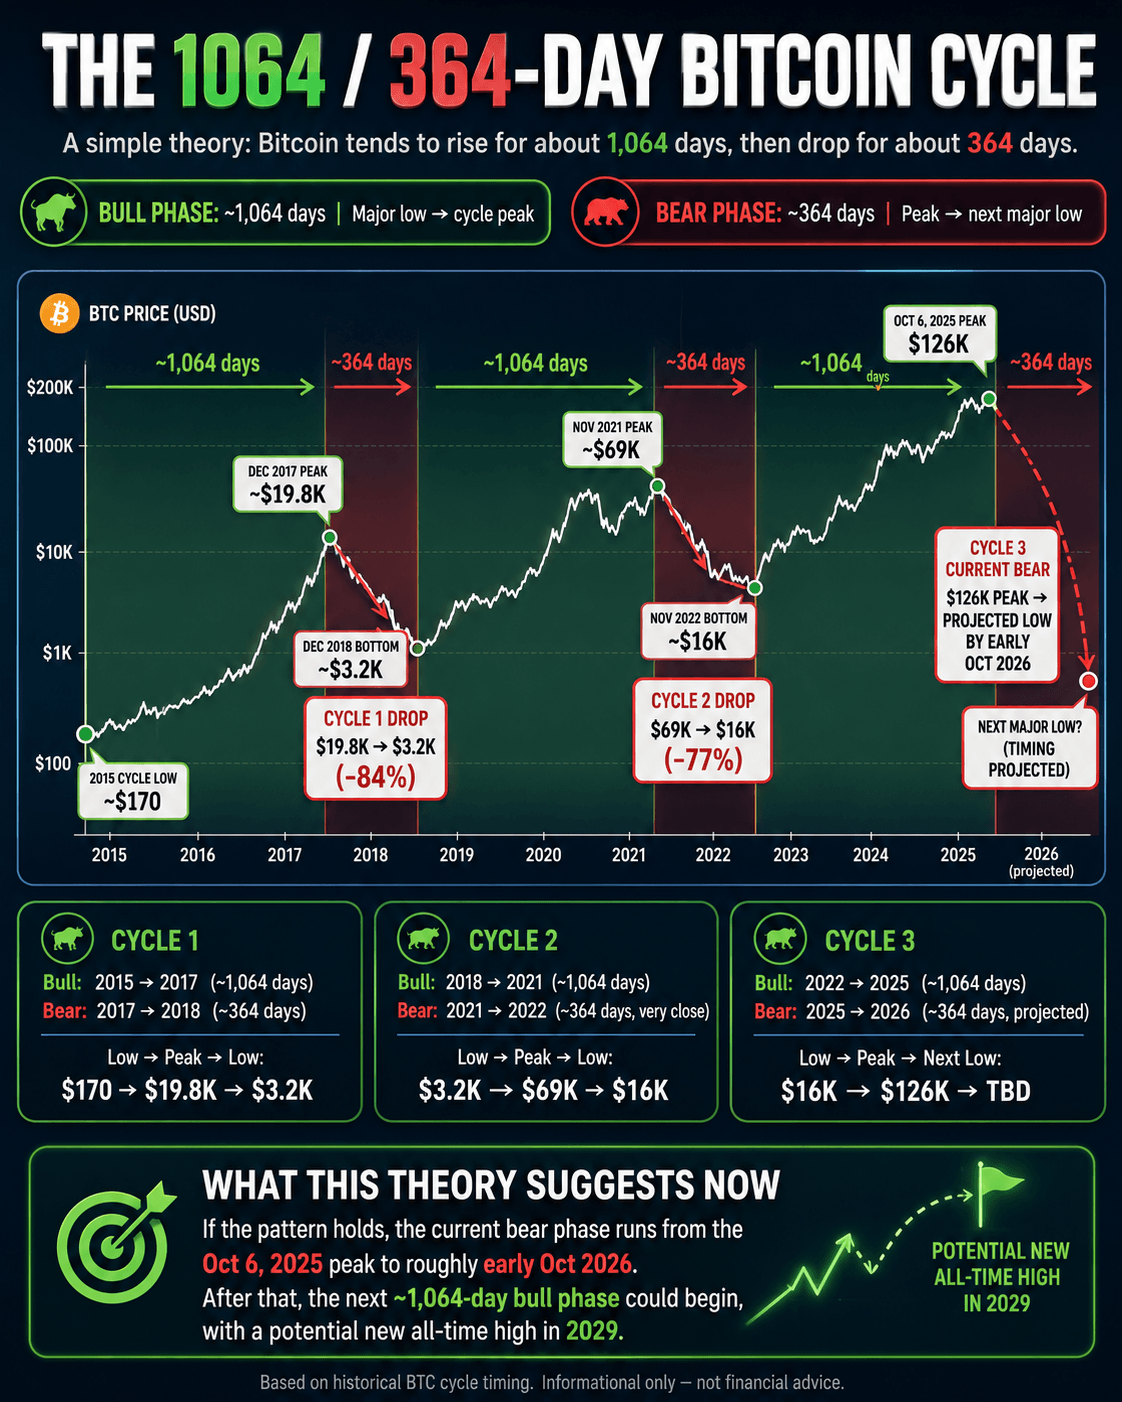
It is not a price-target model. It does not claim Bitcoin must reach a particular dollar level. It is a calendar-based framework: roughly three years up, then roughly one year down.
| Phase | Approximate duration | What it measures |
|---|---|---|
| Bull phase | ~1,064 days | Major low to major cycle peak |
| Bear phase | ~364 days | Major peak to next major cycle low |
Why October 2026 matters
Bitcoin recorded an intraday high of approximately $126,198 on 6 October 2025.1 Under the 364-day bear-phase theory, the central timing estimate for the next major cycle low is therefore approximately 5 October 2026.
That date is not a prediction that Bitcoin must print its lowest price on one specific day. The claim is narrower: if the pattern remains valid, a meaningful low should form around early October 2026.
The practical window to watch is October through December 2026:
- October 2026: Does Bitcoin show a capitulation event, stabilization, or a clear major low?
- November 2026: Does the market begin building a base instead of continuing a clean breakdown?
- December 2026: Does the apparent low hold, with early signs of a broader recovery structure?
A low that forms within or shortly after this period would support the model. A major low far earlier, or a prolonged decline that produces a materially later low, would weaken it.
The historical case
Supporters of the framework point to the broad rhythm of Bitcoin’s major cycles since 2015. Historical reference points vary slightly by exchange, time zone, and whether an analyst uses intraday highs and lows or closing prices. The numbers below are rounded for clarity.
| Cycle | Low → Peak → Next Low | Why it matters |
|---|---|---|
| Cycle 1 | ~$150–$170 → ~$19.8K → ~$3.2K | Long bull move into late 2017, followed by an approximately one-year bear market. |
| Cycle 2 | ~$3.2K → ~$69K → ~$16K | Similar broad expansion-and-reset structure, although the timing was less exact. |
| Cycle 3 | ~$16K → ~$126K → next low unknown | The active test case for the theory. |
The model has been circulated most prominently in recent commentary by analyst Ali Martinez, who argued that Bitcoin’s prior major cycles took roughly 1,064 days from bottom to top and approximately 364 days from major top to bottom.2
The biggest weakness: the sample size is tiny
This is the central issue. There are only a few major Bitcoin cycles available for comparison. Three broadly similar cycles do not establish a market law.
Small samples make pattern analysis vulnerable to hindsight bias. It is easy to find a neat rhythm after the fact, especially when analysts can choose between different exchanges, intraday wicks, daily closes, local highs, and local lows.
That does not make the model useless. It makes the next cycle especially important. The October–December 2026 period is effectively an out-of-sample test: a public window in which the theory can gain credibility or lose it.
Why a recurring rhythm could exist
A repeating pattern does not require a hidden group controlling every Bitcoin move. Markets can create recurring behavior when participants respond to similar incentives.
Bitcoin has repeatedly moved through a recognizable sequence: deep pessimism, accumulation, momentum, speculation, leverage, distribution, forced selling, and rebuilding. Liquidity, macroeconomic conditions, derivatives positioning, miner economics, ETF flows, regulation, and retail sentiment can all influence the duration of those phases.
There is also a self-fulfilling element. Once enough investors watch a cycle model, their risk management and positioning may help reinforce the timing window — until the market eventually breaks the pattern.
What would count as confirmation?
The theory should not be judged by a single intraday wick. A more credible confirmation would involve several signals appearing around the expected window:
- A substantial reduction in speculative leverage.
- Extreme bearish sentiment and retail exhaustion.
- Signs of forced selling or miner stress fading.
- Bitcoin stabilizing after a major decline.
- A low that holds through the following weeks or months.
- Early evidence of accumulation and a broader recovery structure.
The model is about timing, not a guaranteed bottom price. It should not be used to infer that a specific dollar level is inevitable.
What to watch next
The key question is simple:
Does Bitcoin form a meaningful major low around early October 2026, or during the months immediately following?
If the answer is yes — and that low holds into late 2026 — the 1064/364-day model becomes more difficult to dismiss. If the market bottoms far outside that window, the theory will look more like a neat historical pattern than a durable timing tool.
Bottom line
The 1064/364-day Bitcoin cycle is a hypothesis, not a proven law of markets. Its appeal comes from being specific enough to test: the next major low should appear around early October 2026, with October through December providing the more realistic confirmation window.
Bitcoin’s history has often rhymed, but it has never owed anyone a repeat performance. Watch the date, watch the structure, and treat certainty with caution.
Not financial advice: Historical cycle analysis is inherently uncertain. Do your own research, consider risk carefully, and do not make investment decisions based on a single theory, chart, date, or analyst view.
Sources
- Yahoo Finance — Bitcoin USD (BTC-USD) historical data . Daily data lists an intraday high of $126,198.07 for 6 October 2025.
- TradingView / NewsBTC — “When Will Bitcoin Bottom? History Points To October 2026, Says Analyst” . Summary of Ali Martinez’s 1,064-day / 364-day cycle thesis.
- Bitbo — Bitcoin Price History Chart . Used for long-run historical context and rounded cycle reference points.
POPULAR ARTICLES
View all