![The 1064/364-Day Bitcoin Cycle [INFOGRAPHIC]](https://www.shortspike.com/static/34/1064-364-cycle__scale_and_crop__500x281.png)
 Markets, data, and the ideas shaping them.
Candlestick Patterns Explained
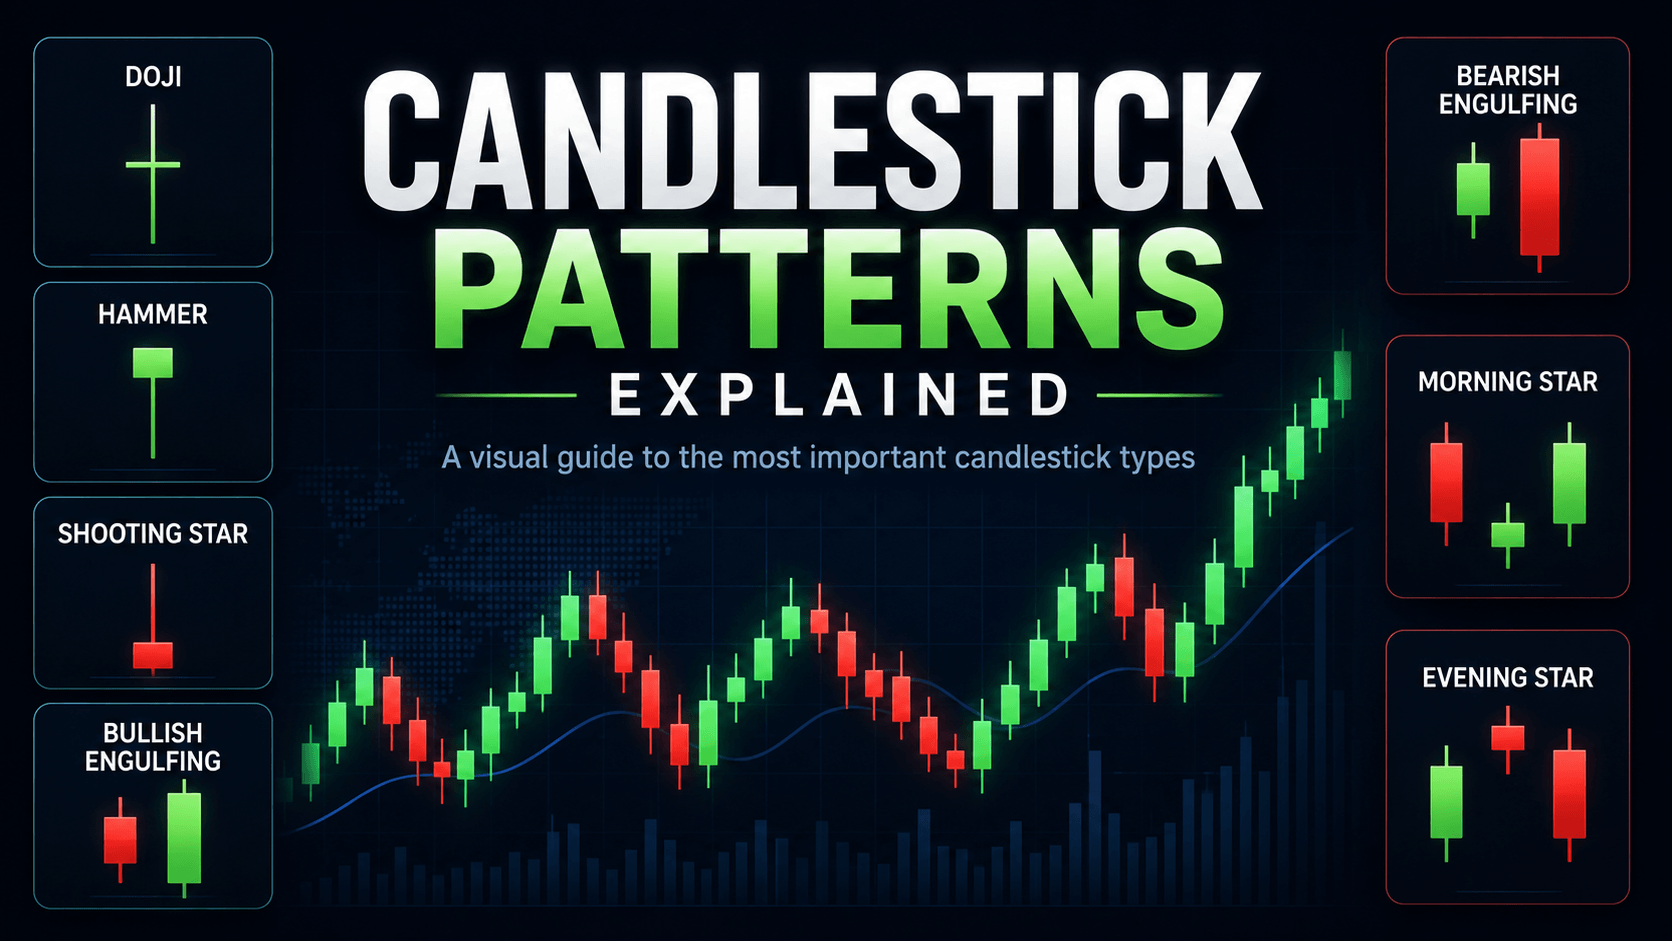
Candlestick charts make it easier to read price action by showing where price opened, closed, and moved during a selected period. Traders use candlestick patterns to identify momentum, indecision, rejection, potential reversals, and possible trend continuation.
Important: Candlestick patterns are not guarantees. Their usefulness depends on context, including trend direction, support and resistance, volatility, volume, and confirmation from later price action.
Index
- Candlestick Anatomy
- How to Read Candle Bodies and Wicks
- Single-Candle Patterns
- Two-Candle Patterns
- Three-Candle Patterns
- Continuation Patterns
- How to Use Candlestick Patterns Properly
- Final Takeaway
Candlestick Anatomy
Every candlestick shows four prices for a selected timeframe:
- Open: The first traded price.
- Close: The final traded price.
- High: The highest traded price.
- Low: The lowest traded price.
The real body is the range between the open and close. The thin lines above and below the body are called wicks or shadows. They show where price moved before returning toward the close.
How to Read Candle Bodies and Wicks
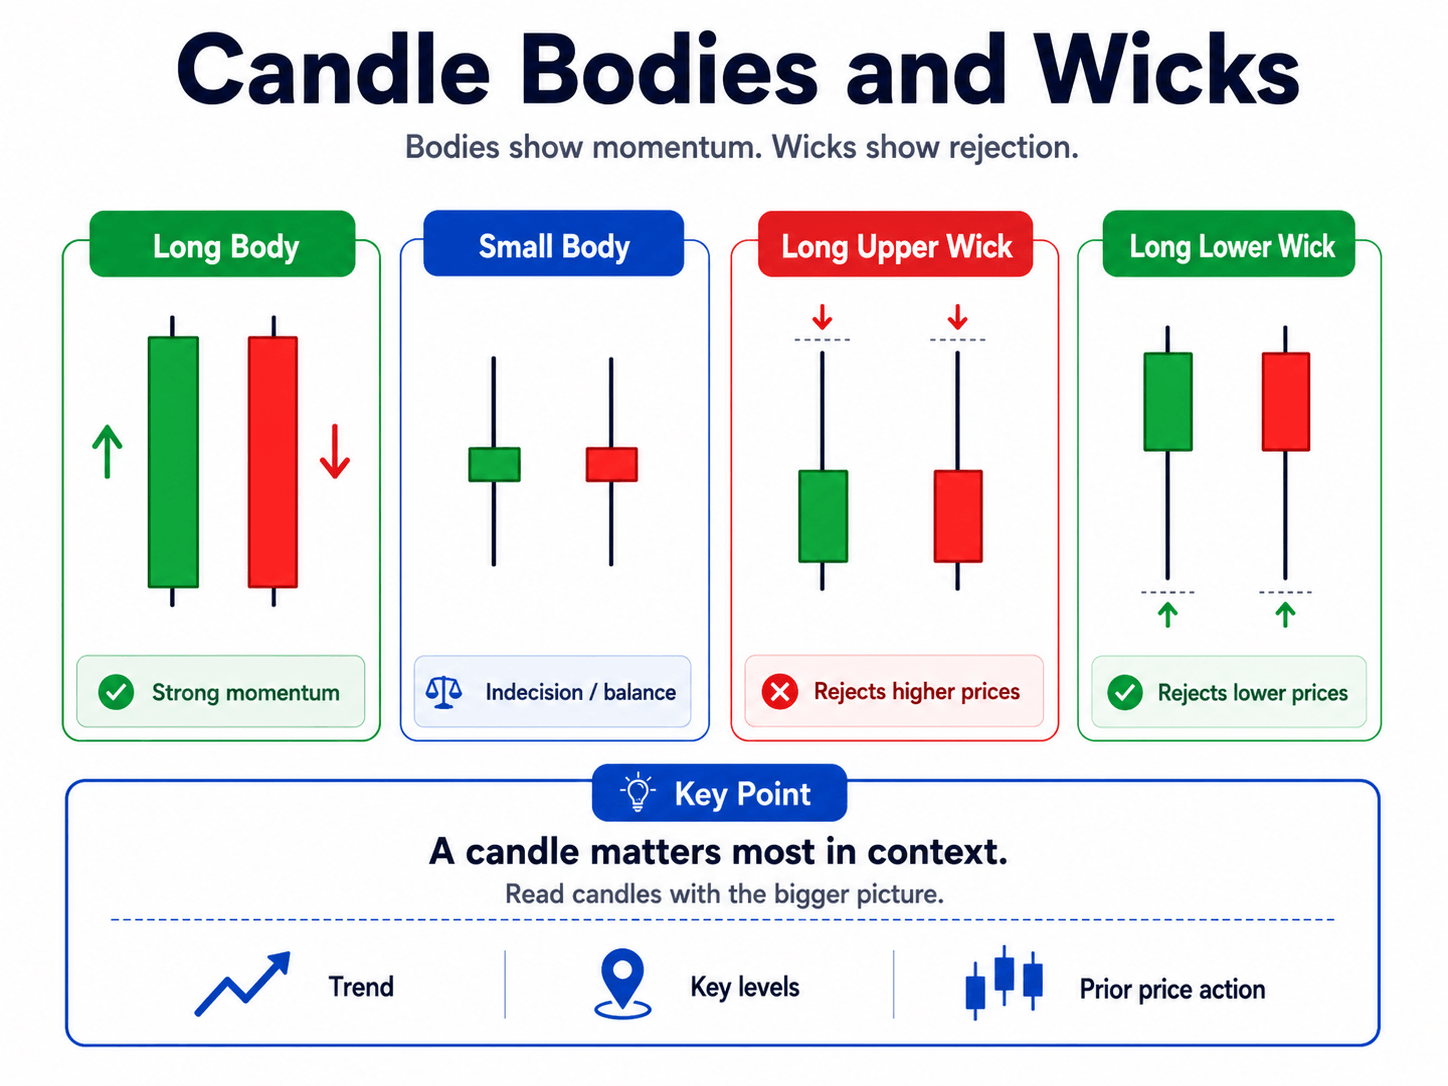
A long body usually indicates strong directional momentum. A small body suggests indecision or balance between buyers and sellers.
Long upper wicks can show rejection of higher prices. Long lower wicks can show rejection of lower prices. However, a candle only becomes meaningful when viewed alongside the broader trend and key price levels.
Single-Candle Patterns
Bullish and Bearish Candles
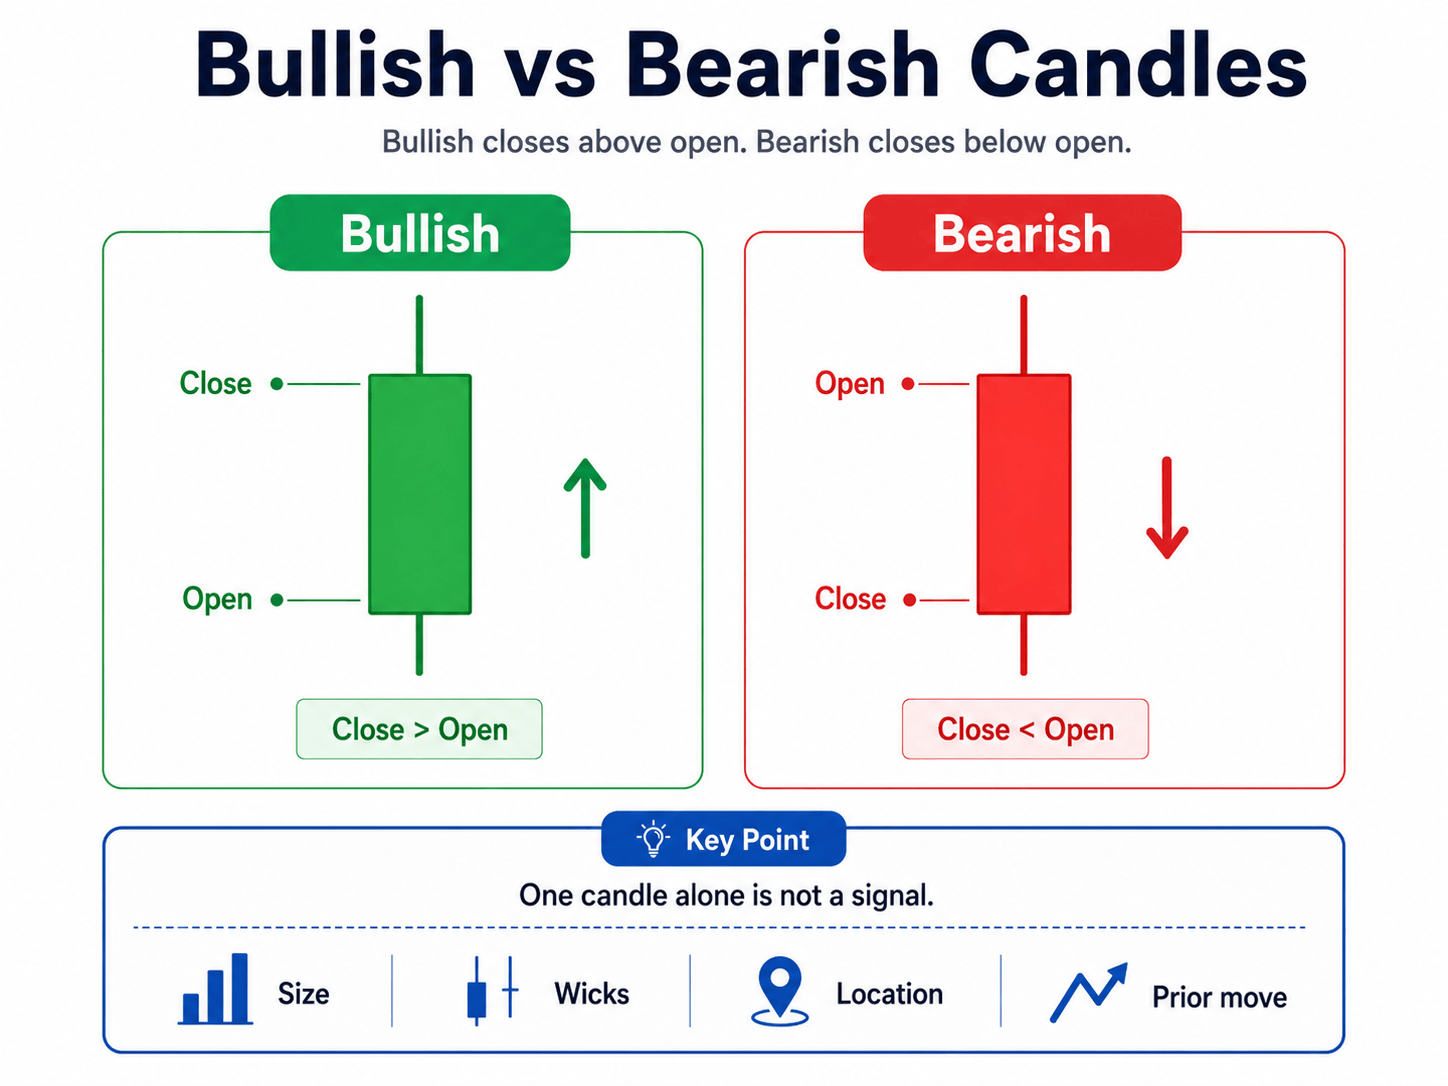
A bullish candle closes above its open. A bearish candle closes below its open.
A single green or red candle is not automatically a signal. Its relevance depends on its size, wick structure, location, and what happened before it.
Marubozu
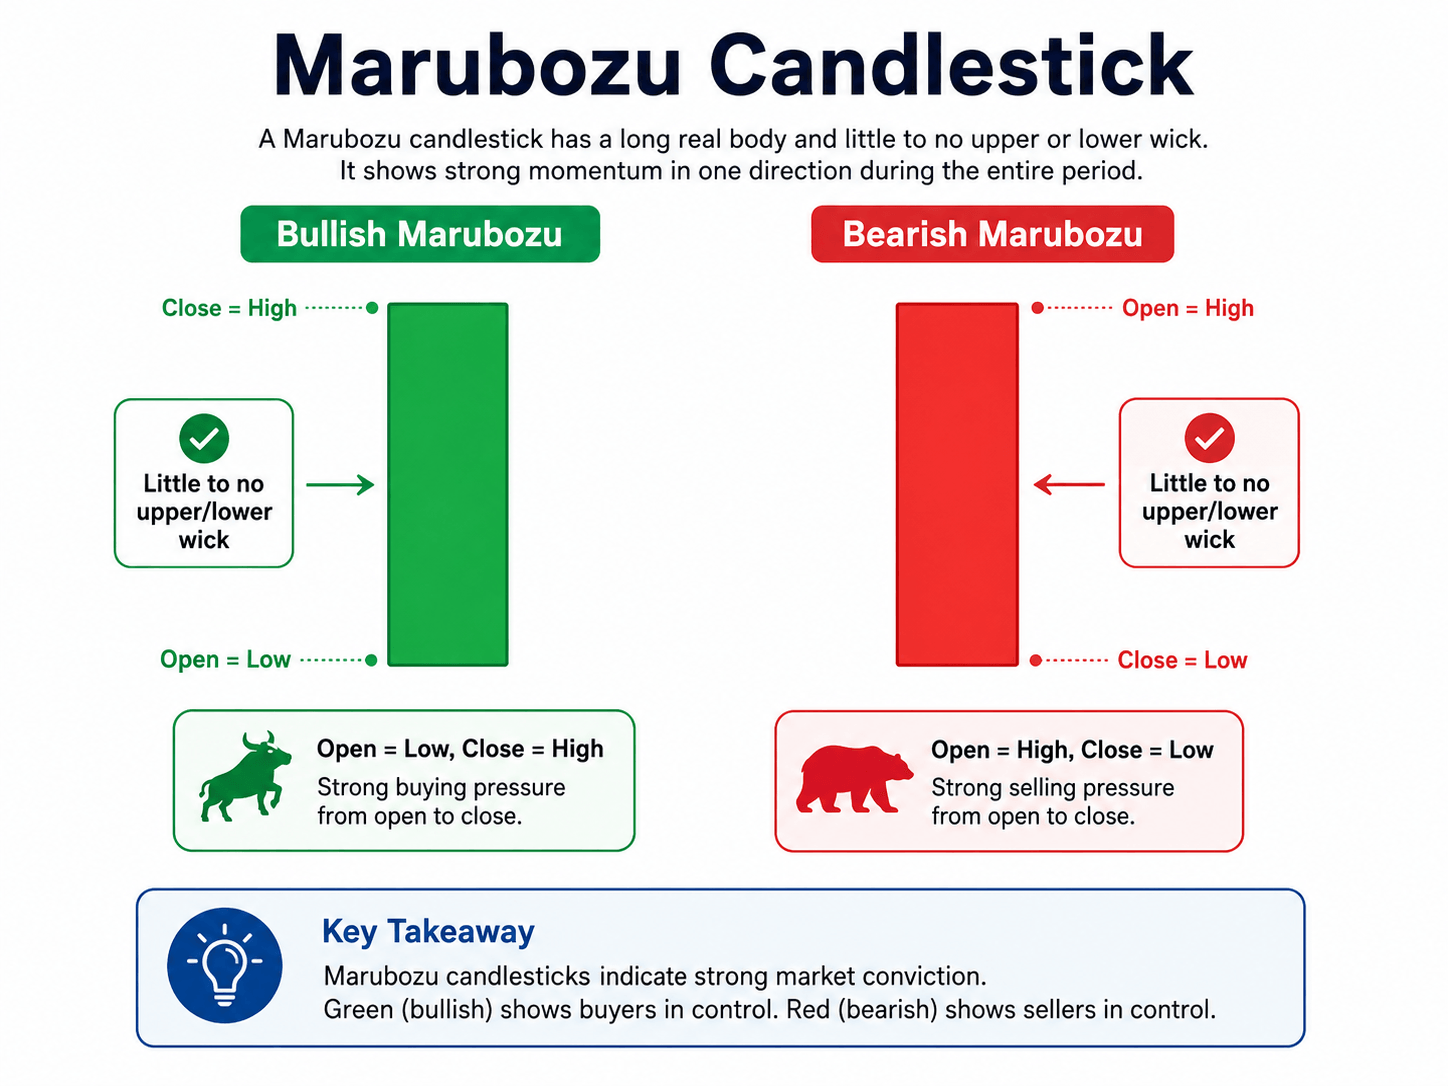
A marubozu is a long candle with little or no wick.
A bullish marubozu opens near its low and closes near its high, showing strong buyer control. A bearish marubozu opens near its high and closes near its low, showing strong seller control.
Spinning Top
A spinning top has a small body with visible upper and lower wicks.
It signals uncertainty. Buyers and sellers both moved price, but neither side maintained control into the close.
High-Wave Candle
A high-wave candle has a small body and unusually long wicks on both sides.
It indicates high volatility and disagreement between buyers and sellers. These candles are often seen during uncertain market conditions or near potential turning points.
Doji
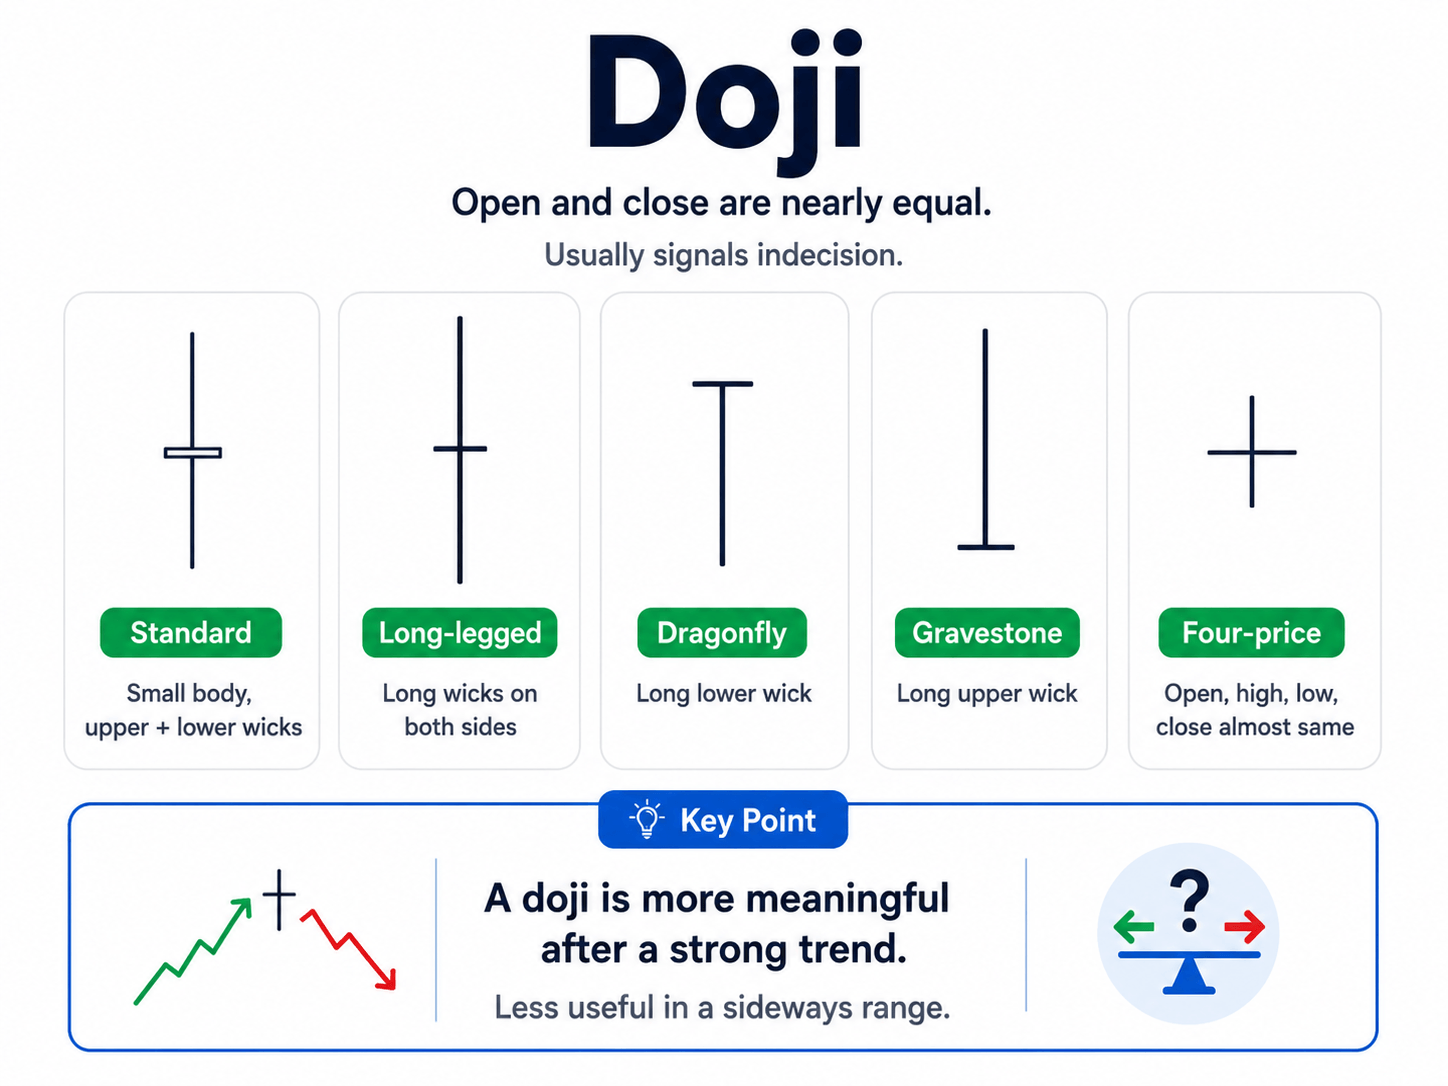
A doji forms when the open and close are very close together.
A doji reflects indecision. Common variations include:
- Standard doji: Small or no body, with upper and lower wicks.
- Long-legged doji: Long wicks on both sides, showing volatility.
- Dragonfly doji: Long lower wick and little or no upper wick.
- Gravestone doji: Long upper wick and little or no lower wick.
- Four-price doji: Open, high, low, and close are almost identical.
A doji after a sustained trend can be more meaningful than one in the middle of a sideways range.
Hammer
A hammer has a small body near the top of its range and a long lower wick.
It is most relevant after a decline. Sellers pushed price lower, but buyers recovered enough to close near the high of the candle. This can suggest that downside momentum is weakening.
Hanging Man
A hanging man has the same shape as a hammer but appears after an advance.
The long lower wick shows that sellers were able to push price lower during the period. It becomes more meaningful if later candles confirm weakness.
Inverted Hammer
An inverted hammer has a small body near the low of its range and a long upper wick.
After a decline, it can show that buyers tested higher prices and may be beginning to challenge the downtrend. Confirmation is important because the candle still closes near its low.
Shooting Star
A shooting star has the same shape as an inverted hammer but forms after an advance.
The long upper wick shows that buyers pushed price higher but could not hold the move. It may indicate potential exhaustion near resistance.
Belt Hold
A belt hold is a strong candle that opens near one end of its range and moves decisively in the opposite direction.
A bullish belt hold opens near the low and closes strongly higher. A bearish belt hold opens near the high and closes strongly lower.
Two-Candle Patterns
Bullish Engulfing
A bullish engulfing pattern forms after a decline when a smaller bearish candle is followed by a larger bullish candle that fully covers the prior candle’s body.
It suggests that buyers have overwhelmed the previous selling pressure.
Bearish Engulfing
A bearish engulfing pattern forms after an advance when a smaller bullish candle is followed by a larger bearish candle that fully covers the prior candle’s body.
It can suggest that sellers have taken control.
Bullish Harami
A bullish harami forms after a decline when a large bearish candle is followed by a smaller candle contained within the first candle’s body.
It suggests that selling pressure may be slowing.
Bearish Harami
A bearish harami forms after an advance when a large bullish candle is followed by a smaller candle contained within the first candle’s body.
It can indicate that upward momentum is weakening.
Harami Cross
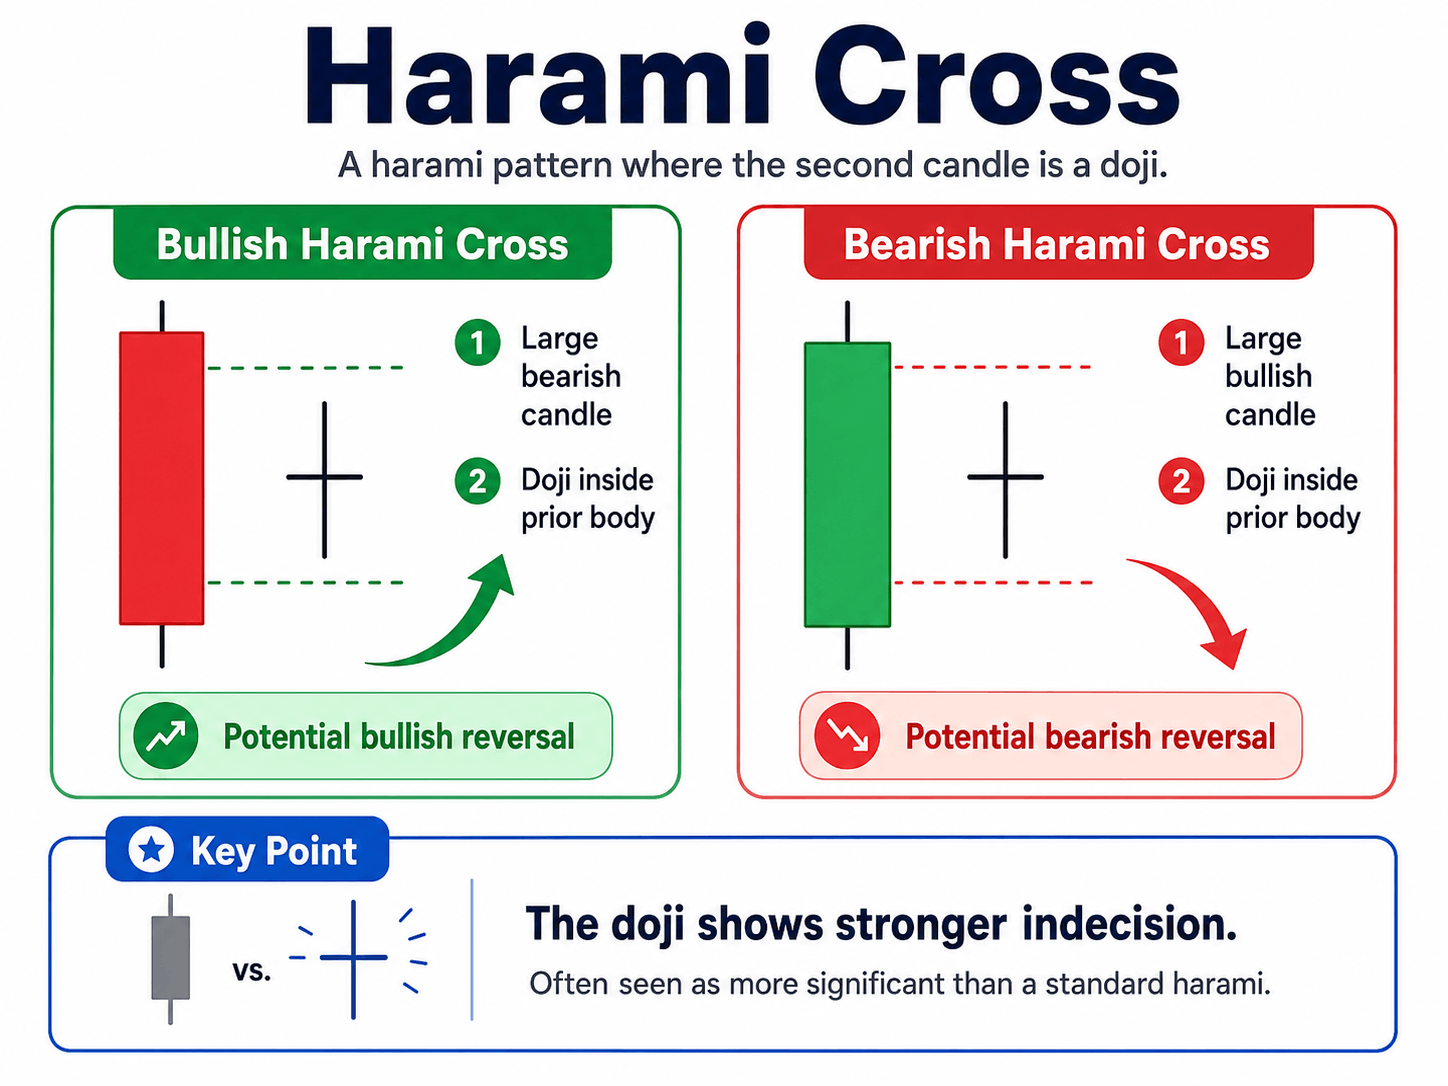
A harami cross is a harami pattern where the second candle is a doji.
Because the second candle shows stronger indecision, traders often consider it more significant than a standard harami.
Piercing Line
A piercing line appears after a decline.
The first candle is strongly bearish. The second opens lower but closes above the midpoint of the first candle’s body. This suggests that buyers recovered a meaningful amount of ground.
Dark Cloud Cover
Dark cloud cover is the bearish counterpart to the piercing line.
The first candle is strongly bullish. The second opens higher but closes below the midpoint of the first candle’s body. It can indicate that sellers are starting to take control.
Tweezer Bottom
A tweezer bottom occurs when two candles form similar lows after a decline.
It can suggest that a support level is holding because price was rejected from roughly the same level twice.
Tweezer Top
A tweezer top occurs when two candles form similar highs after an advance.
It can indicate repeated rejection at resistance.
Matching Low
A matching low forms when two bearish candles close at almost the same level after a decline.
It can indicate that selling pressure is losing momentum around a support area.
Counterattack Lines
Counterattack lines occur when two opposing candles close at roughly the same price after a strong move.
Bullish counterattack lines form after a decline. Bearish counterattack lines form after an advance. They suggest a strong response from the opposing side but require confirmation.
Three-Candle Patterns
Morning Star
A morning star is a bullish reversal pattern that appears after a decline:
- A strong bearish candle.
- A small candle showing hesitation.
- A strong bullish candle closing well into the first candle’s body.
It suggests that sellers may be losing control and buyers are returning.
Evening Star
An evening star is the bearish version of the morning star:
- A strong bullish candle.
- A small candle showing hesitation.
- A strong bearish candle closing well into the first candle’s body.
It may indicate exhaustion after an advance.
Morning Doji Star
A morning doji star is a morning star where the middle candle is a doji.
The doji highlights indecision after a decline and may make the setup more notable.
Evening Doji Star
An evening doji star is an evening star where the middle candle is a doji.
It can indicate a more pronounced loss of upward momentum.
Abandoned Baby
An abandoned baby is a rare reversal pattern featuring a doji separated by gaps from the candles on either side.
Bullish abandoned babies appear after declines. Bearish abandoned babies appear after advances. They are more common in markets where genuine price gaps occur.
Three White Soldiers
Three white soldiers are three consecutive strong bullish candles, each closing higher than the previous one.
They can indicate sustained buying pressure after a decline or consolidation.
Three Black Crows
Three black crows are three consecutive strong bearish candles, each closing lower than the previous one.
They can indicate sustained selling pressure after an advance.
Three Inside Up
A three inside up pattern is a bullish harami followed by a bullish confirmation candle.
It consists of a large bearish candle, a smaller contained candle, and a bullish candle closing above the first candle’s close.
Three Inside Down
A three inside down pattern is the bearish equivalent.
It consists of a large bullish candle, a smaller contained candle, and a bearish candle closing below the first candle’s close.
Three Outside Up
A three outside up pattern starts with a bullish engulfing formation and ends with another bullish candle.
The third candle confirms continued buyer strength.
Three Outside Down
A three outside down pattern starts with a bearish engulfing formation and ends with another bearish candle.
The third candle confirms continued seller strength.
Tri-Star
A tri-star consists of three consecutive doji candles.
It is rare and signals unusually strong indecision. It is most relevant after a clear trend.
Continuation Patterns
Rising Three Methods
Rising three methods is a bullish continuation pattern:
- A strong bullish candle.
- Two to four smaller candles moving sideways or slightly lower.
- A final bullish candle that closes above the first candle.
It suggests a controlled pullback rather than a full reversal.
Falling Three Methods
Falling three methods is the bearish counterpart:
- A strong bearish candle.
- Two to four smaller candles moving sideways or slightly higher.
- A final bearish candle that closes below the first candle.
Mat Hold
A mat hold is a bullish continuation formation similar to rising three methods.
It usually begins with a strong bullish move, followed by a brief pullback, and ends with another strong bullish candle.
Tasuki Gap
A tasuki gap is a continuation pattern involving a price gap followed by a candle that moves partly back into that gap.
It can occur in both rising and falling trends. It is most relevant in markets where gaps are common.
Separating Lines
Separating lines occur when two opposing candles open at roughly the same price within an existing trend.
Bullish separating lines can support an uptrend. Bearish separating lines can support a downtrend.
On-Neck, In-Neck, and Thrusting Patterns
These are generally bearish continuation patterns that appear during downtrends.
- On-neck: A bearish candle is followed by a smaller bullish candle closing near the prior low.
- In-neck: The bullish candle closes slightly above the prior low.
- Thrusting pattern: The bullish candle closes deeper into the prior bearish body but remains below its midpoint.
They are usually interpreted as temporary upward reactions within a broader decline.
How to Use Candlestick Patterns Properly
Candlestick patterns should be part of a broader trading framework, not a standalone strategy.
- Trend direction: A reversal pattern against a strong trend may fail quickly.
- Support and resistance: Patterns near major levels are generally more relevant.
- Confirmation: Wait for a break, close, or follow-through candle where appropriate.
- Volume: Higher volume can add conviction to a breakout or reversal.
- Timeframe: A daily pattern typically carries more weight than the same pattern on a very short timeframe.
- Risk management: Define invalidation, position size, and exit criteria before entering a trade.
Final Takeaway
Candlestick patterns provide a visual language for understanding price behaviour. They help identify momentum, rejection, indecision, reversals, and continuation.
The most useful patterns to learn first are:
- Doji
- Hammer
- Shooting Star
- Bullish and Bearish Engulfing
- Piercing Line
- Dark Cloud Cover
- Morning and Evening Star
- Three White Soldiers
- Three Black Crows
- Rising and Falling Three Methods
Use them with market structure, key levels, confirmation, and disciplined risk management. A pattern can highlight an opportunity, but it does not predict the future.
POPULAR ARTICLES
View all